The state of the news media, digital ad spending, web audience behavior, tablets, mobile operating systems, ebooks, video strategies, and traffic referrals are among the topics covered in this month’s installment of TFP’s Media Metrics roundup.
Every month, we compile excerpts from some of the key stories covering issues affecting the publishing and media industries to help you keep up with current media industry trends and prepare for changes that are just around the corner. See our top picks below.
State of the News Media 2014 (Pew Research Journalism Project)
- Thirty of the largest digital-only news organizations account for about 3,000 jobs, and one area of investment is global coverage.
- The news industry in the U.S. brings in a little over $60 billion of revenue annually, according to estimates.
- Fifty percent of social network users share or repost news stories, images or videos, while nearly as many (46%) discuss news issues or events on social network sites.
- Ad revenue tied to digital videos overall grew 44% from 2012 to 2013 and is expected to continue to increase. For now, though, its scale is still small, accounting for just 10% of all digital ad revenue in the U.S.
- Advertising, at least for now, still accounts for the majority of known news revenue—a little over two-thirds. Audience revenue is the next largest source of income for the industry, accounting for about a quarter of the total news pie through subscriptions, cable fees, and individual giving.
Study: Social Media Isn’t Replacing Traditional News Outlets at All (Fast Company)
- A new survey, part of the just-announced Media Insight Project, unearthed some interesting data regarding news consumption: Readers don’t seem to really care about what organization they’re getting their news from, or what device format they’re reading on; what matters, really, is the news itself.
- The research indicates that nearly half of Americans with Internet access sign up for news alerts of some kind.
- According to the findings, four in 10 Americans said they got their news from social media sites like Twitter and Facebook. But more than 80% said they also go directly to news organization websites for updates, too.
What’s Next for Native Ads? (eMarketer)
- eMarketer estimates that U.S. print ad spending will decline from $32.16 billion in 2014 to $31.29 billion in 2018.
- Digital ad spending on newspapers and magazines will increase to $8.41 billion by 2018, from $7.48 billion in 2014, but these gains will still leave the industry essentially flat for the forecast period.
- In an August 2013 Sharethrough study, awareness was the top marketing objective for native mobile ads among U.S. digital marketing professionals.
- In December 2013, BIA/Kelsey estimated native ad spending on social media alone would grow from $3.1 billion this year to $5.0 billion in 2017. As a percentage of total social ad spending, it projected that native would rise from 38.8% in 2014 to 42.4% in 2017.
What You Think You Know About the Web Is Wrong (Time)
- Chartbeat looked at deep user behavior across 2 billion visits across the web over the course of a month and found that most people who click don’t read. In fact, a stunning 55% spent fewer than 15 seconds actively on a page. One in every three visitors spends less than 15 seconds reading articles they land on.
- Articles that were clicked on and engaged with tended to be actual news. The most clicked on but least deeply engaged-with articles had topics that were more generic. All the topics above got roughly the same amount of traffic, but the best performers captured approximately 5 times the attention of the worst performers.
- Chartbeat looked at 10,000 socially shared articles and found that there is no relationship whatsoever between the amount a piece of content is shared and the amount of attention an average reader will give that content.
- When Chartbeat combined attention and traffic to find the story that had the largest volume of total engaged time, it found that the story had fewer than 100 likes and fewer than 50 tweets. Conversely, the story with the largest number of tweets got about 20% of the total engaged time that the most engaging story received.
- On a typical article, two-thirds of people exhibit more than 15 seconds of engagement; on native ad content, that plummets to around one-third. On the native ad content analyzed, only 24% of visitors scrolled down the page at all, compared with 71% for normal content.
Readers Who Still Click Bookmarks Are More Loyal Customers for News Sites Than Facebook Flybys (Nieman Journalism Lab)
- Pew found that users who arrived at the 26 news sites studied directly spent about three times as long there as opposed to users who arrived via Facebook or a search engine. (By “directly,” the study means arriving by typing in the URL or going to a bookmark.)
- Direct visitors also view about five times as many pages per month and visit a news site about three times as often as users coming from Facebook or search.
- Most people who visit these news sites do so only through one of the methods—directly, via Facebook, or through a search engine—the Pew study found.
- The percentage of people who visited a site directly and through Facebook ranged from 0.9% to 2.3%, with one exception: BuzzFeed, where 11.3% of direct visitors also accessed the site through Facebook.
Digital Ad Spending Poised to Overtake TV (Media Life Magazine)
- In 2018, digital’s share of U.S. ad spending will surpass television’s, albeit by a very small margin—36.4% to 36.1%, according to a forecast from eMarketer.
- Digital ad spending is expected to hit 27.9% this year. Between this year and 2018, its share will grow by another 30%.
- In 2012, mobile made up just 2.6% of all U.S. ad spending. By 2018, it will account for 24.9%, or nearly $1 of every $4 spent. It will make up more than two-thirds of all digital spending.
- Of course, digital’s previous meteoric rise in ad spending came largely at the expense of print. Print’s share of U.S. ad spending will go from 20.7% in 2012 to 14.4% in 2018. That includes 7.4% for newspaper spending and 7% for magazines.
Millennials Consume Content Every Waking Hour (And Then Some) (MediaPost)
- According to new research from Crowdtap, millennials are apparently spending 18 hours per day consuming media. The hours are compounded, meaning that a person watching TV and checking Instagram at the same time for one hour would rack up two hours of media consumption—one for each device.
- Crowdtap says 30% of millennials’ media time is spent with content created and curated by their peers, which means they are also acting as “always-on publishers.”
- Millennials spend 18% of their time on social networking sites, which is still less than the 20% of time they spend browsing the Internet. They spend 13% of their time watching live TV and 10% watching pre-recorded TV.
How Big Can Android Device Sales Get? (Gigaom)
- By the end of next year, there could be nearly four times as many devices sold running on Google Android than on Microsoft Windows, according to Gartner.
- The company expects that of the 2.6 billion computers, tablets, and mobile phones sold in 2015, 1.3 billion of them will run Android.
- Of those expected 2.6 billion computing device sales, Gartner figures 379.3 million of them will run Microsoft Windows. That number includes Windows Phones, tablets running Windows as well as traditional laptops and desktops. That means for every one Microsoft Windows device sold, 3.6 Android devices are purchased.
Interest in Tablets Waning in the U.S., New Research Reveals (Good E-Reader)
- New research by Kantar Worldpanel ComTech has revealed that Apple, Amazon, and Samsung are the key players in the U.S. tablet market, controlling 43%, 24%, and 11% of the user base, respectively.
- A sizable 53% of consumers stated that they won’t buy a new tablet in 2014, while another 34% said they have yet to make up their minds.
- A common reason for many (47% of those who are unsure and 25% of those who said they won’t buy a tablet ) to not invest in a tablet was the high price, despite the fact that the average cost has dropped to $300.
- As for particular brands, the iPad is on top, with 32% claiming to use it daily. Samsung’s Galaxy Tab and Galaxy Note devices come in second, with 24% claiming to use it every day. Kindle Fire makes up the third slot, with 10% claiming to use it regularly.
Ebook Sales Slow, Strategies Shift (EContent)
- A study of about 800 respondents found that nearly 70% of consumers feel it is unlikely that they will abandon print books by 2016, as they have an emotional and visceral/sensory attachment to print books and possibly consider them a luxury item.
- Additionally, 60% of downloaded ebooks are never read in the U.S., despite their perceived popularity.
- While sales of ebooks remain relatively impressive, bear in mind that they were flat or on the decline for much of 2013; the Association of American Publishers recently reported that ebook sales were approximately $128 million last August, down 3% from a year earlier.
3 Graphs That Explain Why Publishers Are Developing Video Strategies (theMediaBriefing)
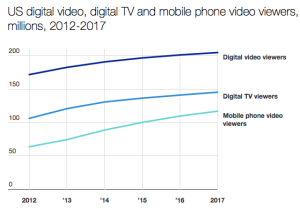 According to data from the Association of Online Publishers and Deloitte, U.K. digital publishers saw digital ad revenue growth of 18% in Q3 2013. Video ad revenue saw the biggest growth at 33.3% and was the fastest-growing sector for the sixth quarter in a row.
- There was also an 83.4% increase in U.K. digital ad spending in 2013, according to eMarketer, who is predicting 2014 growth of 70.8%.
- Over three quarters of 18-to-24-year-olds in the U.S. share video online, and over 64% of 25-to-34-year-olds do the same. Even in the 55+ age group, almost a third of people share video online in the US.
- Digital video viewer numbers are expected to grow 19% in the five years from 2012 to 2017, and mobile phone video viewers are predicted to grow a huge 86% in the same period.
Study: Facebook News Referrals Are ‘Gaining’ on Google (Journalism.co.uk)
- Page views from Facebook increased to 26% in January 2014, up from 16% in October 2013, according to the latest ‘authority report’ from analytics platform Parse.ly.
- Meanwhile, traffic from Google sites, including Google News and Google+, remained top, but fell to 38% in January 2014 from 44% in October the previous year.
- When grouped together, social media now drives more traffic than search within Parse.ly’s network, with 32% of referrals from social compared to 30% from search.
Media Metrics is a monthly feature from Technology for Publishing, aimed at keeping you armed with the latest industry data. If you’d like to share something you’ve read, drop us a note. And keep up with the latest industry news coverage by signing up for our This Week in Publishing emails or our monthly Publishing Trends newsletter.
Posted by: Margot Knorr Mancini
