For everyone in the content business today, data visualization is key—not only because it’s central to effectively telling stories and building brands, but also because it helps strategists see trends and patterns to better target audiences.
But data without the means to make sense of it is, well, just data.
Here we’ve gathered some informative reads that outline best practices for discovering, parsing, and organizing information. From there, they delve into how to best visualize and present data using proven approaches and techniques, detailing some of the top software tools for creating charts, infographics, and more.
From design fundamentals to the most vexing data visualization challenges, our book picks provide a range of valuable insights that can help you on your way to more effective communication!
Data Visualization Book Picks
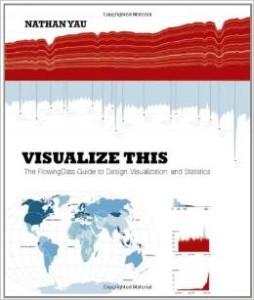
Visualize This: The FlowingData Guide to Design, Visualization, and Statistics by
Data is ever-increasing and can be overwhelming to organize in a way that makes sense to its intended audience. In this full-color book, data visualization guru and author Nathan Yau uses step-by-step tutorials to show you how to visualize and effectively tell stories with data. He explains how to gather, parse, and format data, and design high-quality graphics that help you explore and present patterns, outliers, and relationships.
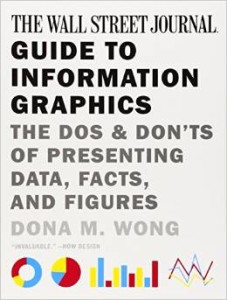
The Wall Street Journal Guide to Information Graphics: The Dos and Don’ts of Presenting Data, Facts, and Figures by
In today’s data-driven world, professionals need to know how to express themselves in the language of graphics effectively and eloquently. Yet information graphics is rarely taught in schools or is the focus of on-the-job training. Now, for the first time, Dona M. Wong, a student of information graphics pioneer Edward Tufte, makes this material available for all of us.
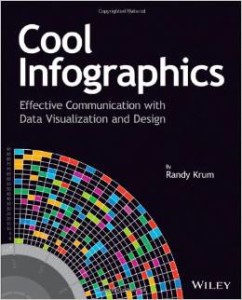
Cool Infographics: Effective Communication with Data Visualization and Design by
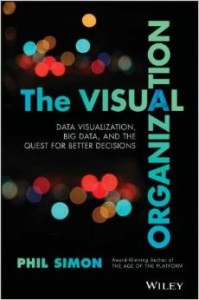
The Visual Organization: Data Visualization, Big Data, and the Quest for Better Decisions by
This book looks at how organizations are embracing new data visualization tools and, more important, a new mind-set based on data discovery and exploration. The author not only shows how Amazon, Apple, Facebook, Google, Twitter, and other tech heavyweights are using powerful data visualization tools to garner fascinating insights into their businesses, but how organizations of all types and sizes are asking better questions and making better business decisions by representing their data in new ways.
Data Visualization: A Successful Design Process by Andy Kirk
Do you want to create more attractive charts? Or do you have huge data sets and need to unearth the key insights in a visual manner? Data visualization is the representation and presentation of data, using proven design techniques to bring alive the patterns, stories, and key insights that are locked away. This book explores the unique fusion of art and science that is data visualization and helps readers overcome contemporary data visualization challenges with a proven design methodology.
Additional Recommended Reading
Designing Data Visualizations: Representing Informational Relationships by Noah Iliinsky and Julie Steele
Infographics: Designing & Visualizing Data by Wang Shaoqiang
Data Visualization with JavaScript by Stephen A. Thomas
If you’d like to share something you’ve read, drop us a note. And keep up with the latest industry news coverage by signing up for our This Week in Publishing emails and monthly Publishing Innovations newsletter.
Posted by: Margot Knorr Mancini


