Branded content, Google’s AMP pages, Snap’s disappointing quarter, growth of mobile ads, global media spend, and more are covered in this installment of TFP’s Media Metrics roundup.
To help you keep up with trends and prepare for changes just around the corner, every quarter we compile excerpts from some key reports covering issues affecting the publishing and media industries. Here are our top picks.
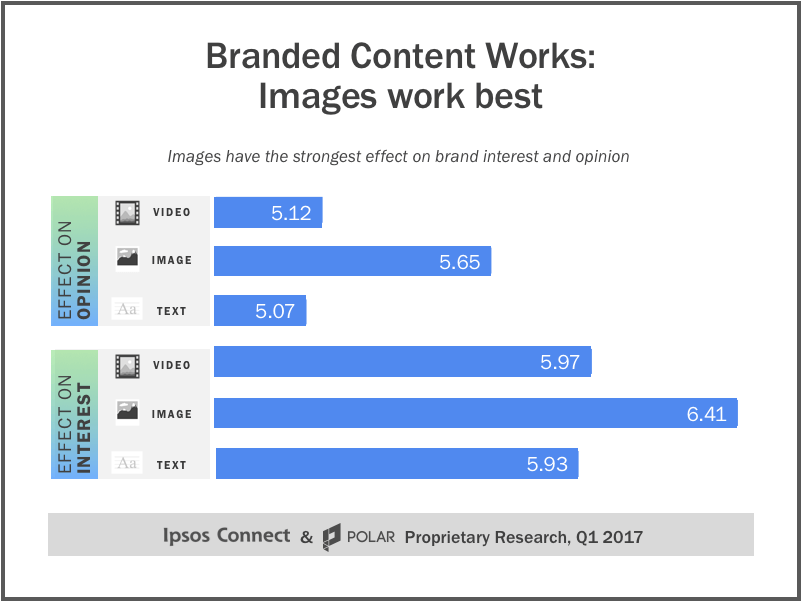
Does Branded Content Drive Brand Lift? New Research Takes an In-depth Look (Marketing Land)
- A recent study found that after engaging with branded content, users’ average unaided awareness was 69% while purchase intent was 51%.
- Users demonstrated 17% more purchase intent when interacting with content accompanied by companion display ads compared with exposure to the content alone.
- Infographics and galleries were 7% more successful than video content in improving user interest, and 9% more effective in improving opinion.
- While 43% of branded content interaction in the study was on mobile devices, purchase intent was more than 17% stronger on desktops.
Google’s AMP Pages Mean Visitors Spend More Time with Content (Recode)
- Data gathered from 360 sites shows that visitors are spending 35% more time on average with Google AMP (Accelerated Mobile Pages) content than with standard mobile web pages—48.2 seconds vs. 35.6 seconds, respectively.
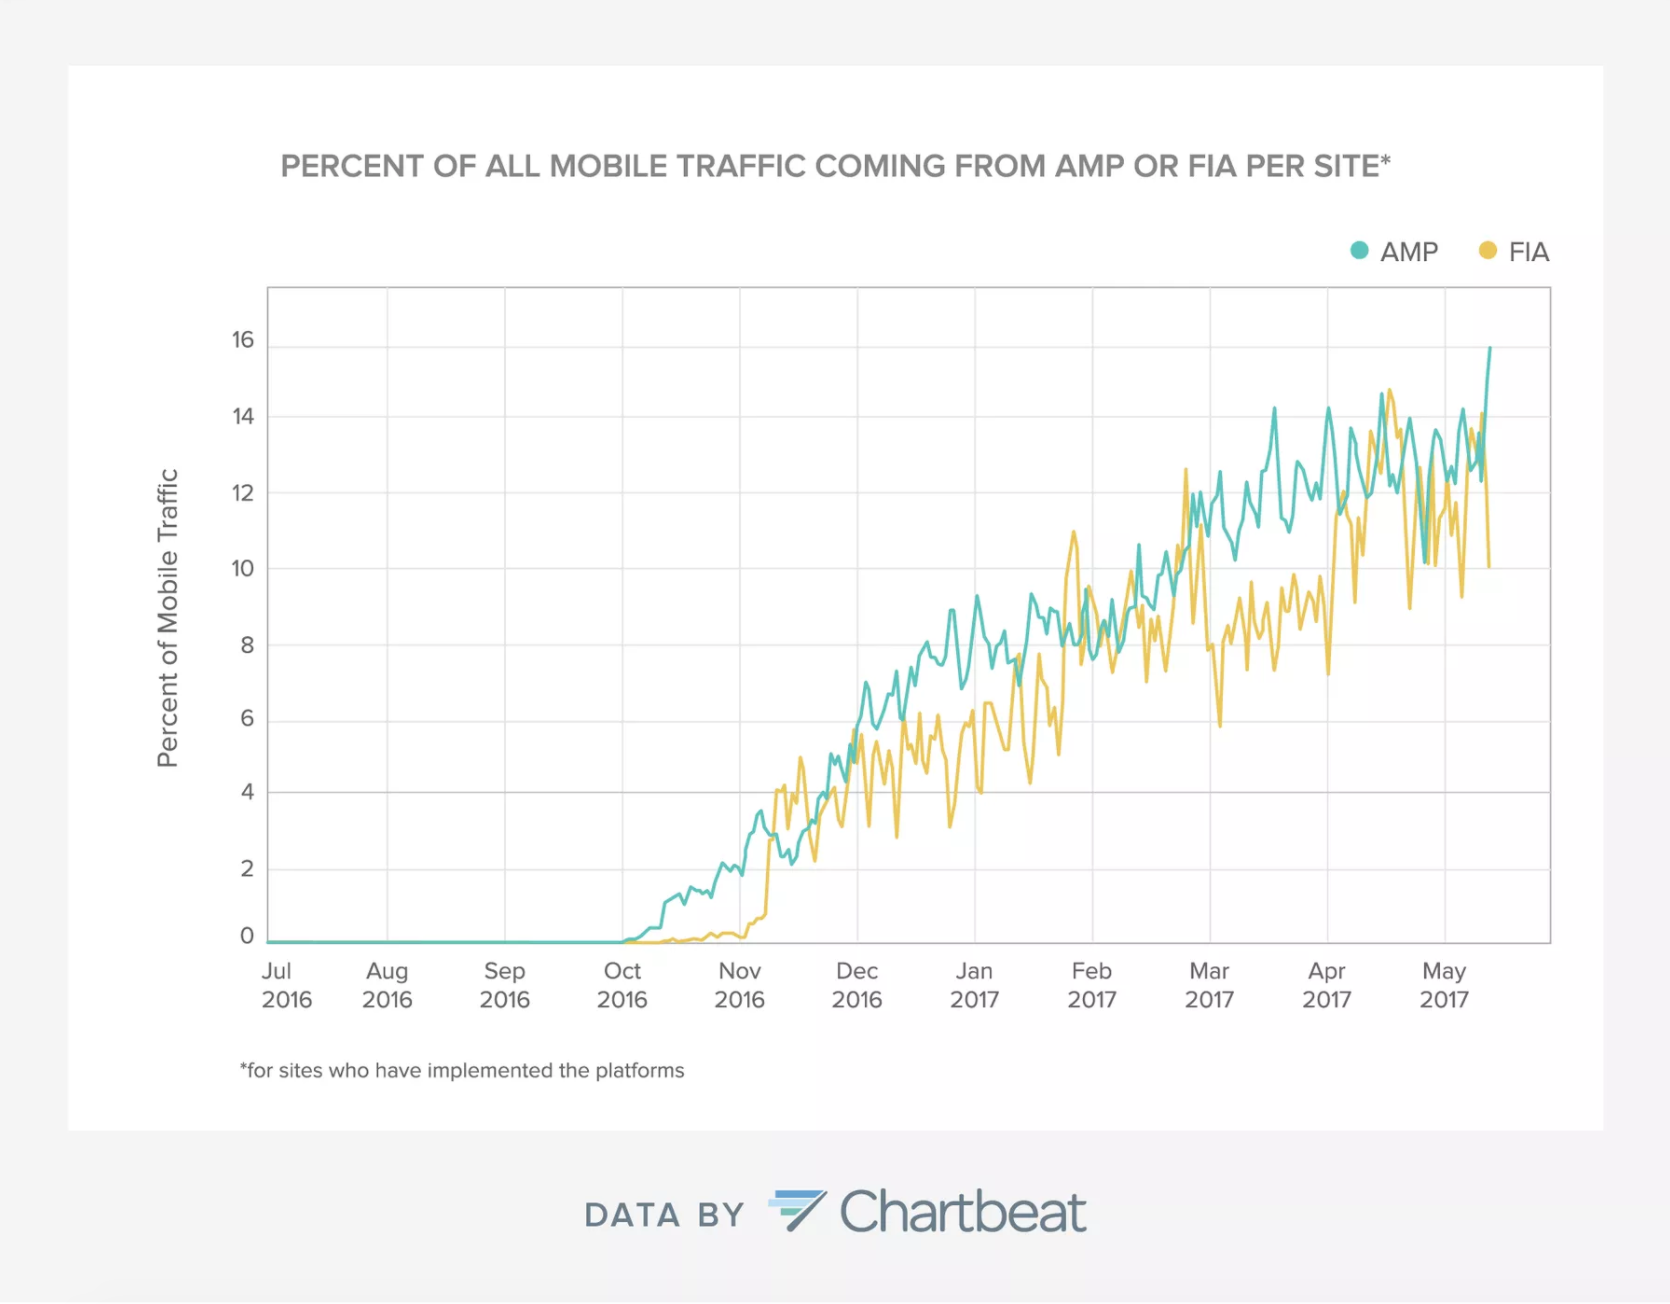
- The median page-load time of a Google AMP page is 1.4 seconds, compared with 5.3 seconds for standard mobile web pages, and less than one-thousandth of a second for Facebook Instant Articles.
- Publishers that use AMP get 16% of their mobile traffic from that content, and those using Instant Articles see 14.8% of mobile traffic from those articles.
Google Image Search Loses Market Share As Amazon, Facebook Rise (MediaPost)
- Recent data shows Google’s core search market share grew from 58.84% in October 2016 to 64.8% in May 2017.
- In the same period, market share for Google Images fell to 21.8%, while Amazon’s share rose to 2.30% and Facebook’s increased to 1.5%. Bing and Yahoo each ticked up to 2.4%, and Google Maps rose to 1.2%.
- Google searches in the U.S. exceeded 30 billion per month in 2016.
- Google referred the most traffic across the web with nearly 63% in May 2017—up from nearly 60% in October 2016.
Snap Stumbles Through Another Disappointing Quarter (NY Times)
- While Snapchat copycat Instagram has been growing rapidly, Snap’s first quarterly report since the company’s IPO fell short of expectations, with a loss of 36 cents a share versus estimates of a 33-cent loss. Its stock has since plunged well below its $17 per share public offering price.
- Revenue in the period rose to only $181.7 million, versus expectations for $185.8 million.
- The company recorded a wider quarterly loss than a year ago of $443.1 million, up from $115.9 million.
Pew’s Digital News Fact Sheet Tracks Growth of Mobile Ads, Facebook’s Growing Share (Talking New Media)
- According to the Pew Research Center, digital display advertising revenue continued to be dominated by just a few companies in 2016, with Facebook comprising 35% of this advertising segment.
- Some 92% of digital-native news outlets are also using Apple News, while 97% are associated with newsletters.
- Digital advertising has increased from just under $32 million in 2011 to just over $71 million in 2016. Meanwhile non-digital advertising has gone from $124.82 million in 2011 to $123.25 million in 2016.
US Publishers Association Statistics: Overall 4.9% Rise in First Quarter (Publishing Perspective)
- According to the Association of American Publishers, U.S. book publishers’ revenue increased 4.9% in Q1 2017, with 1,202 publishers reporting $2.33 billion in revenue for the period.
- Audiobook revenue jumped 28.8%, the third year in which the sector has registered double-digit growth. Meanwhile, ebook revenue declined 5.3% in the same period.
- The association attributed most of the Q1 growth to “increased revenue in two of the largest categories, adult books and higher-education course materials.”
Global Media Spend Up 7.2%, Tops Consumer Price Gains (MediaPost)
- Worldwide consumer spending on media content and technology is growing at a faster pace than global inflation and consumer price index rates, recent data shows, with average spending increasing 7.2% to $299.97 per person in 2016. Growth is attributed to increasing demand for digital media content and tech, which accounts for 70% of overall spending, and lower price hikes for new mobile devices.
- Digital media spending grew 12.2% to $1.05 trillion in 2016, with traditional media content and technology up only 1.6% to $593.19 billion.
- U.S. consumers spent the most: an average of $1,289 in 2016 on all media and technology, reflecting a 5.8% gain over 2015. Among the top 20 markets, India placed last, with average consumer spend of $54.
85% of Americans Use Mobile Devices to Access News—with Seniors are Driving that Number Up (Nieman Lab)
- A Pew Research study found that more than 67% of Americans aged 65 and older get news on a mobile device, an increase from 43% last year and 22% in 2013.
- It also found more lower-income households getting their news via mobile—79% of adults in households making less than $30,000 per year have accessed news on a mobile device. In contrast, in 2013, it was 37%.
- However, only 44% of Americans 65 and older said they actually prefer using a mobile device to get their news. The majority in that age group prefer a desktop computer or laptop, whereas 65% of adults overall prefer getting their news via mobile.
Diversity in Newsrooms has been Bad for Decades and it Probably Won’t get Better: Study (Columbia Journalism Review)
- According to a recent report, minority individuals (black, Asian, Hispanic, Native American, or other) accounted for only one person on the 11-person masthead of The Washington Post, three people on the 18-person masthead of The New York Times, one person on the five-person masthead of NPR, three people on the 14-person masthead of the Chicago Tribune, and one person on the 14-person masthead of The Los Angeles Times.
- While 54% of the people who live in the Washington-Arlington-Alexandria metropolitan area are minorities, only 31% of staffers in The Washington Post’s newsroom are from minority groups. Meanwhile, the Times’ newsroom is 78% white and 22% minorities, while the New York-Newark-Jersey City metro area is 53% minorities.
- With a relatively diverse newsroom, The Los Angeles Times is 66% white and 34% minorities (11% Hispanic, 14% Asian American, and 5% black). That still falls short of the demographic of the Los Angeles-Long Beach-Anaheim metro area, which is 45% Hispanic, 16% Asian American, and 7% black.
Images: Marketing Land, Chartbeat
Media Metrics is a monthly feature from Technology for Publishing, aimed at keeping you armed with the latest industry data. If you’d like to share something you’ve read, drop us a note. And keep up with the latest industry news coverage by signing up for our This Week in Publishing emails and our Publishing Innovations newsletter.
Posted by: Margot Knorr Mancini
