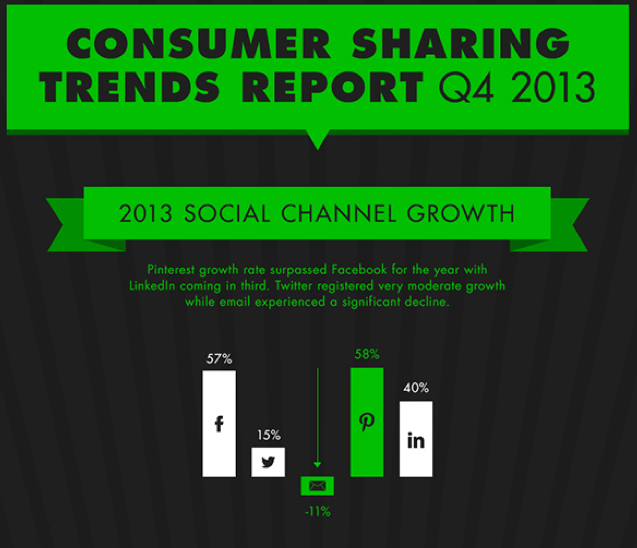
Social-sharing app developer ShareThis released its quarterly Consumer Sharing Trends Report last month, along with an infographic that highlights usage data from top social media sites like LinkedIn, Pinterest, Twitter, and Facebook. The results point to key differences between regions, genders, and growth rates that could prove useful in assessing your social media strategy.
Click the image below to view the full infographic.
Visit Technology for Publishing’s blog each week for interesting and informative media-related infographics we’ve discovered and want to share. Have you seen one out there that you think we should include? Drop us a note!
Posted by: Margot Knorr Mancini


