What Apple Watch owners use their devices for, how hashtags affect engagement on Twitter and Instagram, a continued decline in magazine newsstand sales, Generation Z’s connectedness, and more are covered in this installment of TFP’s Media Metrics roundup.
To help you keep up with trends and prepare for changes just around the corner, each month we compile excerpts from some key reports covering issues affecting the publishing and media industries. Here are our top picks.
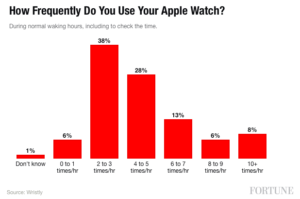
Apple Watch Owners Glance at Their Wrists 60 to 80 Times a Day (Fortune)
- A weekly survey by Wristly.com found 1,450 respondents use their Apple Watches an average of four to five times per hour, or 60 to 80 times a day.
- Users spend an average of 3.8 seconds on each interaction.
- A separate study by the University of Stockholm’s Mobile Life Centre found short interactions like checking the time or glancing at notifications were the most frequent uses of the Apple Watch. In a one-month period, owners used their device to take phone calls only eight times and used it to read mail only twice.
Do Hashtags Mean Engagement on Twitter, Instagram? (Social Times)
- In a recent three-month study, analytics firm Locowise found that not only did hashtags have no effect on engagement rates on Twitter, but tweets without hashtags outperformed those with them.
- It reported that 55.8% of tweets didn’t include hashtags, while 4.75 had three or more.
- On Instagram, posts with three hashtags had the highest engagement rate, at 3.03%. However, posts with no hashtags followed close behind, with a 3.02% engagement rate.
- Some 49% of posts on Instagram had four or more hashtags, even though engagement rates declined after three.
Magazine Newsstand Sales Tumble Again (MediaPost)
- Third-quarter newsstand and other retail sales of print magazines fell 10.3% compared with the same period last year, from 128.8 million units to 115.5 million, MagNet reported.
- The total dollar value of sales dropped 9.8%, from $697 million to $628.9 million.
- In the first half of the year, the total volume of magazines distributed by wholesalers declined 2.6%, to 784 million.
- The number of issues sold in the same period dropped 18.5%, from 254.5 million to 207.5 million. The dollar value of those sales fell 13.9%, from $1.29 billion to $1.11 billion.
Here’s What Publishers Are Doing to Keep Up 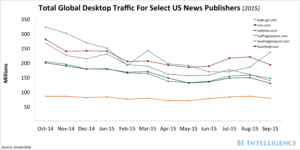 with Increasing Mobile Media Consumption (Business Insider)
- A BI Intelligence report highlights comScore data showing mobile accounted for two out of every three minutes spent consuming digital media in the U.S. in June.
- The data also shows total time spent consuming digital media using mobile apps reached nearly 779 billion minutes in the same period.
- In contrast, users in June spent 551 billion minutes consuming digital media on PCs.
Generation Z Takes Breaks From Mobile, Social (Social Times)
- According to a study by branding firm Wildness, nine out of 10 Generation Z users (those born after 1995) reported taking occasional breaks from their mobile devices, with 54% saying they do so daily.
- Seven out of 10 study participants said they often delete apps, with Twitter and Vines being the two they delete most often. Facebook, meanwhile, was deleted by 21% at some point.
- Those 12 to 24 years old post 38% more on Snapchat daily than on Facebook, and just 44% of that group said they use Facebook on a regular basis.
- Other findings: 84% said they use social media for entertainment, 82% use it to discover new things, and 76% use it to connect with others.
B2B Media Revenue is Up Four Percent in the First Half of 2015 (Folio)
- Citing growth in digital advertising and data/business information sales, ABM’s Business Information Network report shows media and information industry revenue in the first half of 2015 hit $14.1 billion, up 4.4% over the same period last year.
- Digital advertising reached $3.12 billion, up 14.7% compared with the first half of last year, while data and business information grew 8.1%, to $1.47 billion.
- Events continued to be the biggest revenue source in B2B media, bringing in $6.26 billion during the first half of the year. That figure accounts for 44.4% of total industry revenue.
Majority of Marketers Are Ill-Equipped to Effectively Use Big Data in Mobile Advertising (Reuters)
- Mobile advertising spend will grow at a 24.6% CAGR through 2019, a threefold increase between 2014 and 2019, according to Forrester estimates.
- While targeting mobile advertising is a top priority for marketers, Forrester found that 13 of 15 marketers interviewed are not satisfied with their current level of targeting, with a majority depending solely on CRM data.
- All study participants said big data could significantly improve targeting, but a majority are limited by their inability to manage the growing volumes of data and a lack of data scientists and tools to analyze and synthesize the data.
Report: Fake User Accounts Cost Businesses Millions of Dollars a Year (Social Times)
- According to a Telesign survey, 43% of companies overlook fake user accounts because they want to keep the process of site/service registration simple.
- While 94% of companies require that users create a password or PIN and 79% require an email address when setting up an account, the survey found far fewer require challenge questions, mobile phone numbers, or other reliable forms of verification, such as social logins.
- It found 30% of respondents believed bad actors using fake accounts signed on to their networks or services to spam legitimate users, and 27% believed perpetrators could potentially steal confidential user information.
- Companies indicated attacks cost them an average of 9% of their user base and 4% of their business partners or other stakeholders.
Study: Advertisers Throw Money at Millennials (Media Life Magazine)
- According to marketing technology firm Turn, advertisers spend 500% more on millennials over other groups.
- It found advertisers spend four times as much on display and social ads targeting millennials versus other groups, four and a half times more on mobile, and six times more on video.
- The firm breaks down the millennial demographic into four groups: 57% are “struggling aspirationals,” 18% are “successful homeowners,” 17% are “active affluents,” and 8% are “comfortable TV watchers.”
Media Metrics is a monthly feature from Technology for Publishing, aimed at keeping you armed with the latest industry data. If you’d like to share something you’ve read, drop us a note. And keep up with the latest industry news coverage by signing up for our This Week in Publishing emails or our monthly Publishing Innovations newsletter.
Posted by: Margot Knorr Mancini
