Print-only newspaper readers, media fragmentation, mobile apps vs. mobile browsing, native ads, and more are covered in this installment of TFP’s Media Metrics roundup.
To help you keep up with trends and prepare for changes just around the corner, each month we compile excerpts from some key reports covering issues affecting the publishing and media industries. Here are our top picks.
Around Half of Newspaper Readers Rely Only on Print Edition (Pew Research Center)
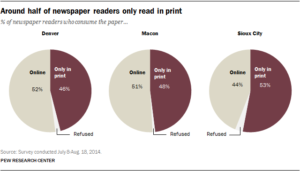
- According to Pew Research data and other research, about half of newspaper readers do not access online versions—they read only print editions.
- In addition, it found print is still the money-maker for most newspapers, generating more than three-quarters of their advertising revenue.
- Who’s buying newspapers? Print-only readers in cities studied are local TV viewers and older (mid-50s) than readers who access newspaper editions online (generally early to mid-40s), according to the report.
Here’s the Big Story of 2016: Fragmentation (Media Life Magazine)
- According to a recent Media Life Magazine survey, fragmentation is the biggest focus for both media buyers and sellers going into the new year, with 55% of respondents saying it tops their list of concerns. No other subject got more than 15% of survey votes, it said.
- Behind that, big stories in 2016 will include ad spending in the 2016 elections, which is projected to reach record levels—$3 billion in the presidential race alone.
- Media executives surveyed also said they will be closely watching the new Nielsen system and how it will impact ad buying and selling as the company expands its sample size and adds online viewing to its ratings.
How Mobile Apps Stack Up Against  Mobile Browsers (eMarketer)
- Recent research from Quixey found that 19.6% of users prefer a mobile browser, 23.1% favor mobile apps, and 24.7% have no preference.
- When asked why they like using mobile apps, 28.3% of survey respondents said apps provide a better user experience and offer more features, including push notifications. On the downside, the users said they dislike the fact that mobile apps take up storage space and don’t provide access to everything they need.
- When it comes to why users like mobile browsing, one-third said it gives them access to all the content they’re looking for in one place, while 23.2% said not having to install anything new on their device is a plus. Some 20.5% of respondents said they dislike mobile browsers because they aren’t as fast as an app, the user experience isn’t as rich, and there are no push notifications.
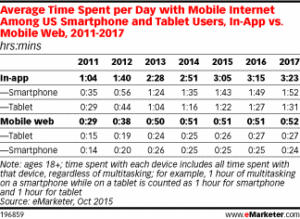
- This year, mobile device users will spend an average 3 hours 15 minutes per day using apps and 51 minutes using mobile browsers.
Consumers Can’t Tell Native Ads From Editorial Content (Media Post)
- New research shows readers have difficulty distinguishing between native advertising and editorial content, with only 8% of participants able to identify native advertising as paid marketing in one study.
- It also found that consumers are seven times more likely to identify paid content as advertising when it is labeled “advertising” or “sponsored content” compared with terms like “brand voice” or “presented by.”
- In a second experiment, researchers found that advertising placed in the middle of the page was seen by 90% of participants while only 40% saw ads placed at the top of the page.
Apple’s Christmas Victory Over Android (Forbes)
- Mobile analytics firm Flurry reported that 49% of all device activations leading up to the holiday season (December 18-25) were Apple products.
- Samsung came in second place at 19.8%, while Nokia, LG, and Xiaomi accounted for the rest of the top five, at 2%, 1.7%, and 1.5%, respectively.
- Larger smartphones accounted for 27% of activations during the holiday period.
- But the research found that the majority of iPhone sales were the smaller, 4.7-in. iPhone 6 and iPhone 6S devices, while 50% of Android sales were phablets.
Another Place Where Google and Facebook Rule (Media Life Magazine)
- Nielsen reported that Google and Facebook claimed the eight most-used smartphone apps in 2015, noting that Facebook had an average of 126.70 million unique monthly users last year.
- Facebook Messenger took the No. 3 spot with an average 96.44 million unique monthly users, and Facebook’s Instagram was No. 8 with 55.41 million monthly users.
- Meanwhile, Google had five apps in the top eight for the year, the report said, with YouTube coming in at No. 2 with 97.63 million monthly users. No. 4 was Google Search at 95.04 million users, No. 5 was Google Play at 89.71 million, No. 6 was Google Maps with 87.78 million, and No. 7 was Gmail at 75.11 million.
People Trust Google for Their News More than the Actual News (Quartz)
- An Edelman survey found for the second year in a row consumers trust Google more than the news organizations that publish the articles the search engine aggregates. Globally, 63% of respondents said they trust “search engines” for news and information while only 53% trust “online-only media.”
- According to the report, the way articles are packaged for various platforms may be behind the disparity: “Headlines that have been optimized for search engines are usually short and fact-based (hence the trust), while headlines shared on other platforms—social media in particular—can be more open to interpretation.”
- It also found that 78% of respondents trust news shared by their friends or family online compared with just 65% who trust news shared by academic experts and 44% who trust articles from journalists.
Digital Media M&A Growth Continued in 2015 (The Wall Street Journal)
- 2015 saw a total of 2,286 merger deals related to digital media, reported Coady Diemar Partners. That’s up from 2,218 in the previous year, reflecting a growth rate of 3.1%.
- Most of the merger and acquisition activity came from the agency and marketing and digital content sectors, with transaction growth rates of 30% and 23%, respectively.
- LUMA Partners reported 262 digital media M&A transactions in the U.S. market in 2015, compared with 202 in 2014, a 30% growth rate.
Media Metrics is a monthly feature from Technology for Publishing, aimed at keeping you armed with the latest industry data. If you’d like to share something you’ve read, drop us a note. And keep up with the latest industry news coverage by signing up for our This Week in Publishing emails or our monthly Publishing Innovations newsletter.
Posted by: Margot Knorr Mancini


