News notifications on smartphones, newsstand units sold and dollar sales, Snapchat ad revenue projections, Google’s survey of mobile users, and more are covered in this installment of TFP’s Media Metrics roundup.
To help you keep up with trends and prepare for changes just around the corner, each month we compile excerpts from some key reports covering issues affecting the publishing and media industries. Here are our top picks.
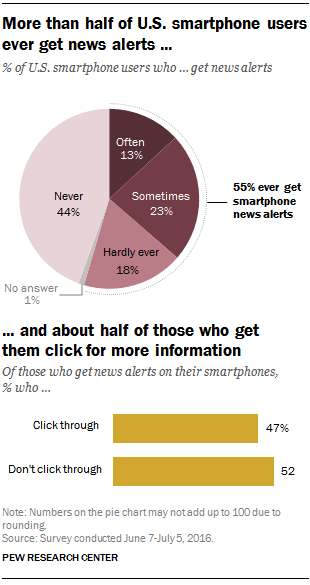
More Than Half of Smartphone Users Get News Alerts, but Few Get Them Often (Pew Research Center)
- A Pew Research survey found that 55% of U.S. smartphone users receive news alerts, but only 13% get them frequently.
- Only about half of those users (47%) who get news notifications click through to the article or search for more information (or 26% of smartphone users overall), the report said.
- Those who follow the news closely are just slightly more likely to get smartphone alerts compared with users who don’t follow the news consistently (58% vs. 52%, respectively). Those who follow news closely, however, click through to articles by a wider margin than those who don’t (53% vs. 42%).
- Although young adults don’t follow the news as closely as older users, the percentage of those receiving news notifications on their smartphones was similar across age groups: 54% of users 18 to 29 years old, 56% of those 30 to 49, and 49% of those 50 to 64.
Newsstand Declines Continue, but Bright Spots Remain (Folio)
- North American newsstand units sold in the first half of 2016 decreased 10.8% compared with the same period last year, according to MagNet.
- Average cover price rose to $5.55 from $5.28 in the first half of last year, helping to offset a decline in dollar sales of 6.2%.
- The report said units sold in the combined celebrity and women’s categories, which account for 36.4% of all newsstand sales, declined 14.3%. Meanwhile, home and garden fell 15.2% and health and fitness dropped 15.1%.
- However, general interest magazines saw substantial increases in dollar sales (22.5%) and units sold (23.6%) compared with the same period last year. The entertainment category was up as well, with a 2.3% increase in units sold and a 14.1% jump in dollar sales.
Snapchat Ad Revenues to Reach Nearly $1 Billion Next Year  (eMarketer)
- According to an eMarketer projection, Snapchat ad revenue will hit almost $1 billion next year, a jump from $366.69 million this year.
- However, while Snapchat accounts for 31.6% of social media users in the U.S., it generates only 2.3% of social ad dollars (its ad platform launched mid-2015).
- Snapchat Discover currently brings in the largest share of the company’s advertising revenues (43%), the report said. But next year, revenue from Stories will overtake that of Discover, generating 37.8% of Snapchat’s ad revenue in the U.S.
- While 95% of its ad dollars are now generated in the U.S., a quarter of that revenue will come from outside the U.S. by 2018.
What Google Learned From the Digital Diaries of 1,000 Mobile Users (Adweek)
- According to a Google survey on the benefits of mobile device use, 92% of respondents who used their smartphone to research a product or service said they made a purchase within a day, and 76% of users who searched for something in their local area visited a related business within a day.
- To meet daily needs, 96% said they use their phone, while 73% use a laptop and only 33% use a tablet. Half of the survey respondents use more than one device.
- The majority of those polled cited convenience and close proximity as the reasons they’re likely to turn to their phone to address their needs. At the same time, 37% said they like to use a laptop because it offers the “best experience” compared with a smartphone (36%).
- Just 10% of respondents said they use print newspapers, magazines, or books to meet their daily needs, while 29% said they ask a person directly.
Gallup poll: Public Confidence in Media Falls to All-Time Low (Politico)
- Trust in mass media has sunk to the lowest point since Gallup began polling consumers on the topic in 1972: In Gallup’s most recent survey, just 32% of respondents said they have “a great deal” or “a fair amount” of confidence in media, a drop of 8 percentage points compared with 2015 results.
- It found distrust in the media was most pronounced among Republicans, with the percentage of that group reporting confidence in the media dropping from 32% last year to just 14%.
- Trust in media fell across age groups as well: The study showed that for the first time in 15 years, trust in the media among those 50 and older was below 40%.
Publishers Outperform Non-Publishers on Every Measure of Ad Effectiveness (Publishing Executive)
- A comScore survey of Digital Content Next (DCN) member sites found digital ads on publishers’ websites get more attention than those on non-publisher sites—across every metric.
- On brand lift, DCN sites outperformed non-publisher sites by 67%, with an average lift of 0.89 vs. 0.53, respectively.
- Overall, publisher sites bested those of non-publishers at every stage in the marketing funnel, with the survey showing publishers are three times more effective in the critical mid-funnel, where consumers are considering a product and intend to recommend that brand.
- It also found that publishers’ ad viewability rate on average is 50% vs. 45% for non-publishers.
Book Reading 2016 (Pew Research Center)
- According to a Pew survey, 73% of Americans have read a book (in any format) in the past 12 months, a number the center said hasn’t changed much since 2012.
- However, print books continue to dominate among U.S. consumers, with 65% reporting they read a print book last year compared with only 28% who said they read an e-book. Just 14% said they listened to an audio book in the same period.
- The survey found consumers read an average (mean) of 12 books per year, with the typical (median) reader consuming four books in the past year. Those numbers have remained about the same since 2011, the report said.
Study: Over Two-Thirds of Americans Still Read Print Magazines (Folio)
- A survey by Mequoda found that 70% of U.S. consumers read a print magazine in the past 30 days, and 51% read at least two publications—figures that are largely the same as those cited in last year’s study.
- However, 41% of respondents said they have read at least one digital magazine in the past month, up from 37% a year ago.
- The number of multiplatform magazine consumers increased 32% over last year, though the study didn’t break out how many readers were previously print-only vs. digital-only. It said females are 1.76 times more likely to be print-only consumers.
- The survey also found that multiplatform readers tend to be older and wealthier than digital-only consumers and 1.67 times more likely to spend more than $100 a year on digital magazines compared with digital-only readers. But only 1.8 percent of those polled said they spent that amount on digital content in the past 12 months, while 76.1% said they spent nothing at all.
WHOA: Facebook Gets Bulk of Social Media Dollars (Media Life Magazine)
- According to eMarketer, Facebook will take in nearly 68% of global ad spending on social media this year.
- Meanwhile, Twitter, the No. 2 contender, will account for just 7.9% of spending in 2016. All other social networks combined bring in just over 24% of total social ad spend.
- That projection means Facebook stands to rake in $22.37 billion total, up from $17.08 billion last year, with more than half of that generated outside the U.S.
Facebook, Instagram Top Networks for Magazine Industry (WWD)
- According to the Q2 Magazine Media 360° Social Media Report, Facebook and Instagram are the top social media sites for magazines, with leader Facebook alone claiming nearly half of all magazine industry likes and followers.
- Meanwhile, Facebook-owned Instagram grew 16% in the quarter, making it the fastest growing platform among those measured and pushing it ahead of Twitter.
- Leading magazines on all social (combined likes and followers) were National Geographic Magazine, ESPN The Magazine, National Geographic (account has different names across networks), Vogue, The Economist, Time, Playboy, Forbes, National Geographic Traveler, and People.
OUCH: Here’s More Grim News on Cord-Cutting (Media Life Magazine)
- The latest quarterly figures from BTIG Research show the number of pay TV subscribers dropped 12 times faster over the past year than it did the year before.
- It said 705,000 people canceled their subscriptions to the top eight providers in the 12-month period ended in June, compared with just 59,000 in the same period a year ago.
- The report said that just a few years ago, pay TV providers were adding subscribers by 1% to 2% a year but are now losing 2% annually due to cord cutters and “cord nevers.”
Media Metrics is a monthly feature from Technology for Publishing, aimed at keeping you armed with the latest industry data. If you’d like to share something you’ve read, drop us a note. And keep up with the latest industry news coverage by signing up for our This Week in Publishing emails or our Publishing Innovations newsletter.
Posted by: Margot Knorr Mancini
