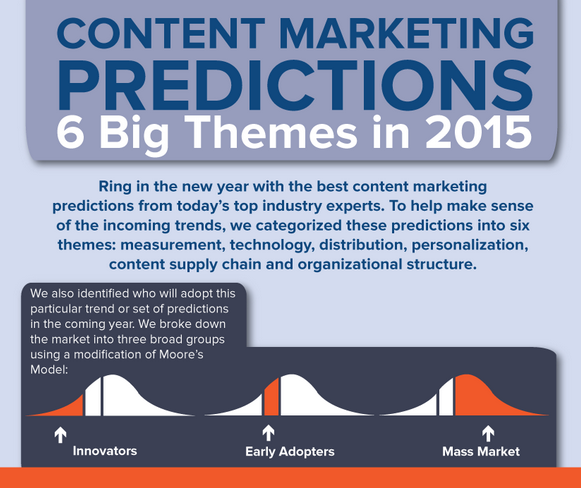
To help you plan for the new year, we’re highlighting an infographic from Curata that offers a roundup of content marketing projections from industry experts, broken down into six categories: measurement, technology, distribution, personalization, content supply chain, and organizational structure. It provides insights on not ...
This week’s infographic pick, from data analysis firm AddThis, highlights the year’s biggest social media trends from around the world, covering everything from the growth of social and mobile to the events that generated the most traffic. One site that saw a huge jump was Vietnamese ...
If you’re a content creator, you know how challenging it is to grab and keep the attention of today’s online audiences. One consideration is length: Whether a Facebook post or podcast, how long your content is matters. This week’s infographic pick, brought to you ...
Why should marketers and content providers pay attention to SEO when planning their social media activities? Our Infographic Pick of the Week lists eight reasons, highlighting how integrating the two into your company’s marketing plans makes for the most effective campaigns. ...
This week, we highlight an infographic that explains which file type — JPEG, GIF, or PNG — is best to use when saving an image. Created by Who Is Hosting This and posted on Taxi, it breaks down everything from when the three file formats ...
Of the four major digital ad formats—rich media, video, mobile, and standard banner—which are likely to perform best for your business? That’s the question our Infographic Pick of the Week addresses, highlighting recent research on clickthrough rates (CTR), engagement times and rates, and ...
This week’s infographic pick addresses the million-dollar question when it comes to social media: How do you get your followers to actually read and engage with your content? While having a lot of followers is great, if true engagement is lacking, you’re missing the mark. ...
If you work in the publishing industry, you’ve likely heard the terms paid, owned, and earned media. But what do they mean exactly? That’s what this week’s infographic pick from The Media Octopus, posted on AllTwitter‘s website, explains. It breaks down the differences between ...
This week’s infographic pick from Dot Com Infoway highlights important advances in iOS 8, including some 4,000 new APIs that allow developers to build more engaging iPhone and iPad apps and better customize the user experience. It also looks at Apple’s overhaul of the ...
With the holiday season around the corner, marketers are focusing on how to drive greater sales and brand reach through social media outlets. According to an Offerpop survey, highlighted in an infographic on AllTwitter‘s website, more than two-thirds of respondents will increase ...
Content marketing is quickly evolving, but today’s “brand newsrooms” face some significant challenges in finding the resources they need to produce enough content to engage their audiences. In fact, lack of time is a big problem for 69% of content marketers, with only ...
This week’s infographic pick from Carabiner Communications, posted on MarketProfs‘ website, takes a nostalgic look at how storytelling has changed over the past 10 years. And what a decade it’s been! From blogs to wearable technology, the ways in which we communicate have evolved dramatically, and for better or worse, ...
With all the noise around social media’s potential to drive sales and brand awareness, you’d think it would be at the top of every CMO’s list. But that’s not the case, according to an OutMarket infographic posted on the SocialTimes website. While highlighting social ...
To celebrate its first year in business, ebook subscription service Scribd put together a fun infographic that explores what people are reading. It found that mind, body, and spirit and business titles are big in the nonfiction world, but many readers don’t finish ...
In 2014, women business owners are mostly optimistic about both the performance of their companies and the economy overall, according to this week’s infographic pick from the National Association of Women Business Owners and Web.com. The organization, which surveyed 600 women business owners on the current ...
Visual content is exploding on social media, and it’s no surprise: Our brains process visuals 60,000 times faster than text. That’s according to this week’s Infographic Pick of the Week from Oracle, posted on the SocialTimes site. Yahoo, for one, has ...
Technology has made it possible for digital marketers to send their messages around the globe nearly instantaneously. But for their campaigns to be successful, they need to understand their global audiences and how to navigate the changing landscape. This week’s Infographic ...
Google’s numbers are mind-boggling: 2.4 million search queries, more than 20 million ad impressions, 1.15 million Play Store app downloads. And that’s in just 60 seconds, according to our Infographic Pick of the Week from Sumocoupon, posted on SocialTimes’ website. ...
Consumers are increasingly using smartphones to make online purchases, and publishers like Domino and Rodale are getting in on the action by launching virtual retail stores that bring in additional revenue. This week’s infographic pick takes a look at smartphone ...
Who’s stealing ebooks, and who is paying? What’s the future for digital rights management, and how does this affect publishers and authors? Those are the questions that WhoIsHostingThis.com examines in this week’s infographic pick. When it looked into the matter ...